Some folks never see the beauty of math. Today's visual delight may take some of you back to childhood. Not through numbers or explanations, but through pictures.
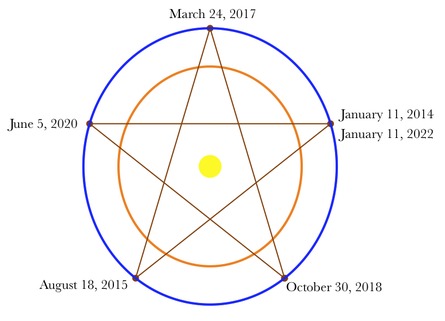
People who despise details despise math. The other day, I watched the sun, Venus, and Earth align five times in eight years (or thirteen orbits of Venus). I hope you did, too. The animation is cool! I saw how connecting the dots of each alignment (or interior conjunction) makes a beautiful star yesterday. There was one important detail I ignored — actually, there are many. Today, we'll explore one.
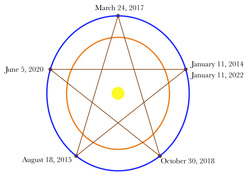
To create the first picture, I assumed the conjunction happens EXACTLY five times in eight years, or every 484.41 days. However, NASA states that the sun, Venus, and Earth align every 483.92 days.
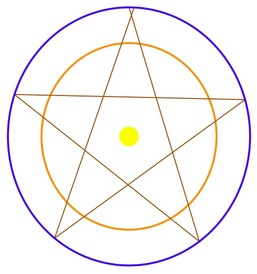
Does only half a day difference matter? This picture shows that it does! Do you see how the top point of the star does not exactly line up?
What happens if I keep plotting the conjunctions?
Does only half a day difference matter? This picture shows that it does! Do you see how the top point of the star does not exactly line up?
What happens if I keep plotting the conjunctions?
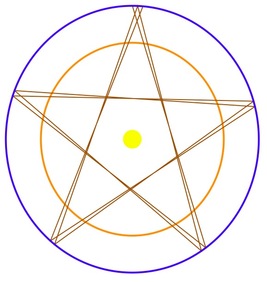
In Grapher, I added conjunctions to shift the top point counter-clockwise to the next one. Guess how many years that took! (Each shift is half a day, and the earth orbits in one year.) I put my math at the spoilers page for those longing to know how I calculated the degrees for this plot.
I calculated the future positions in a spreadsheet — but, you don't have to do a bunch of math! If you're ready for a break from snow, grab some hot chocolate and watch a new animation showing the star's formation. I recommend a speed of ten!
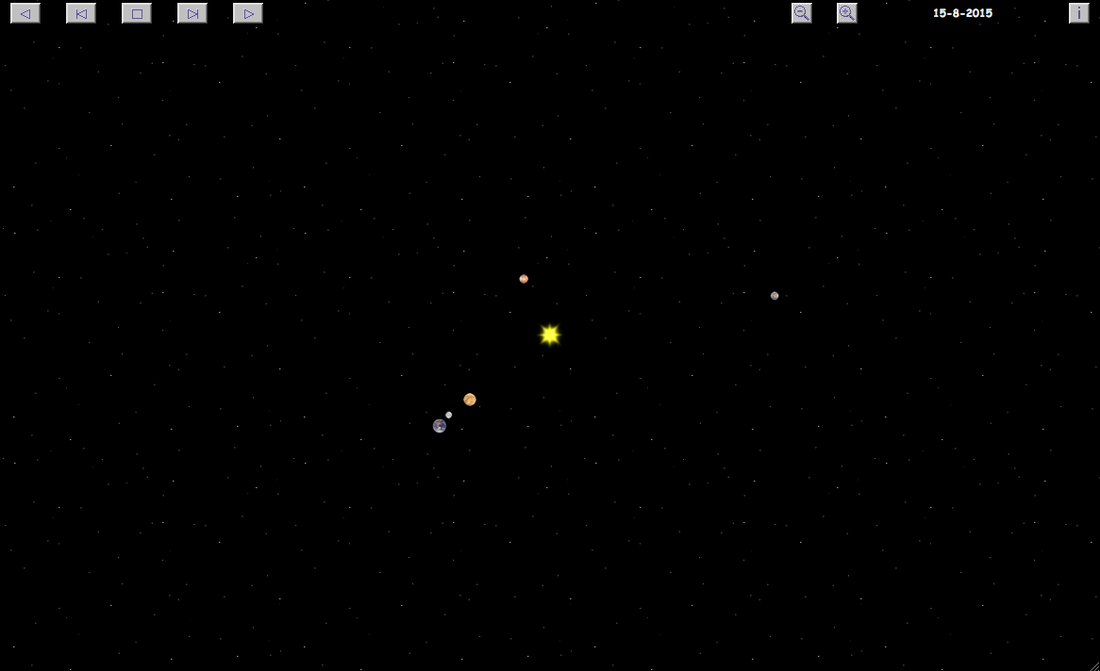
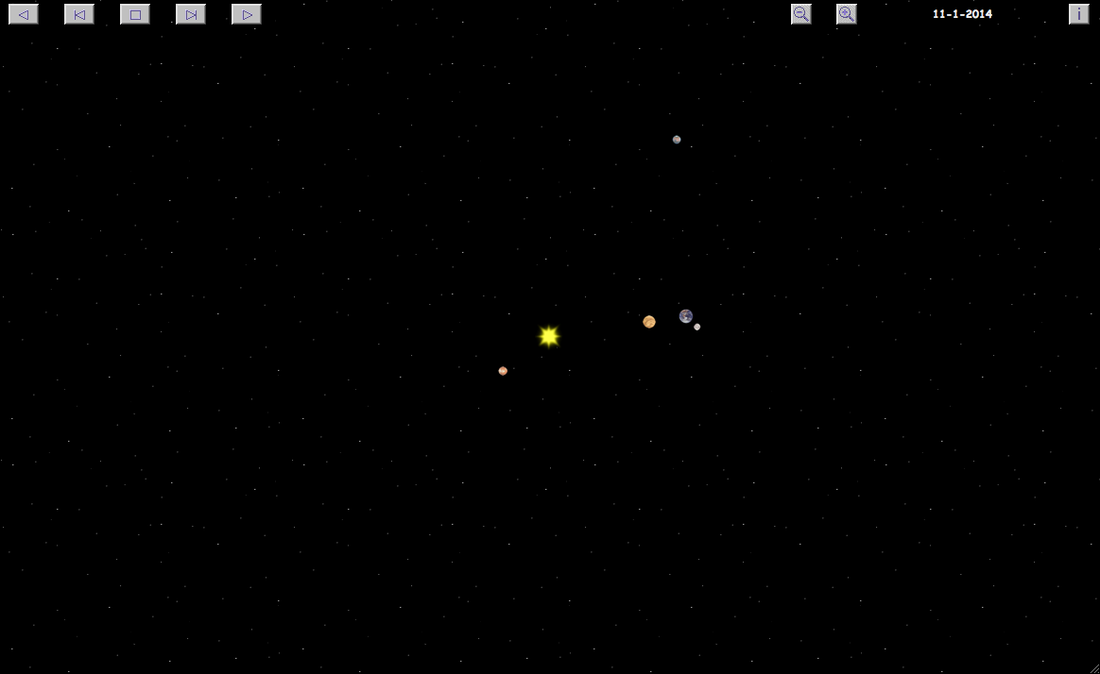
Below is a screenshot I took from the animation. This one starts in June 2004. I stopped it at roughly today. Right before the conjunction is about to happen.
I calculated the future positions in a spreadsheet — but, you don't have to do a bunch of math! If you're ready for a break from snow, grab some hot chocolate and watch a new animation showing the star's formation. I recommend a speed of ten!
Below is a screenshot I took from the animation. This one starts in June 2004. I stopped it at roughly today. Right before the conjunction is about to happen.
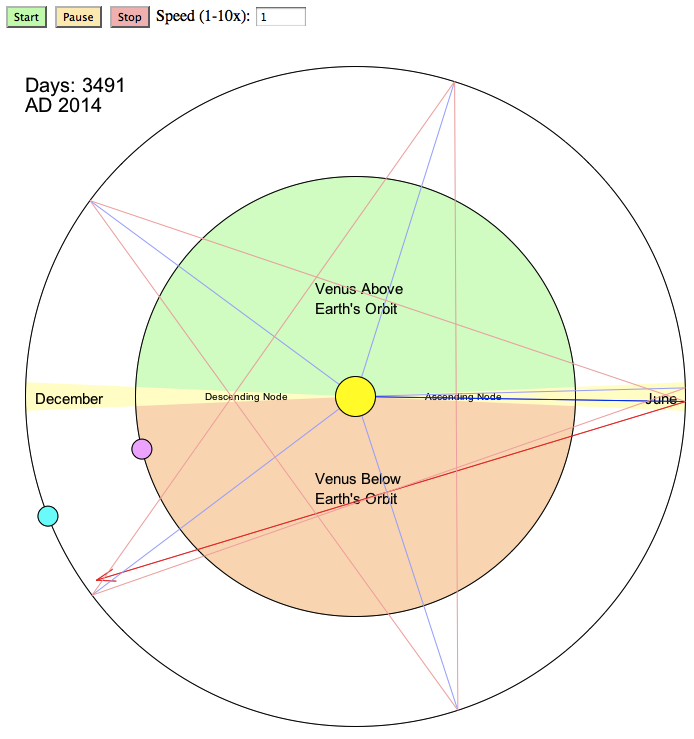
Screenshot: if you click it, you will be transported to the animation.
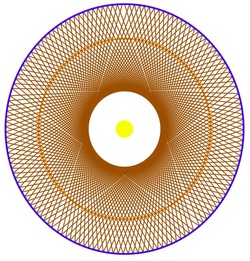
Here is the projection I made in Grapher for the next couple of centuries. Isn't that gorgeous?
I hope you now can see a little bit of beauty in math.
Below is something I drew to replicate this. It took me back to my college days when I spent one summer hanging out with fellow plebes in the hallway, plotting problems on “mo boards.”
I hope you now can see a little bit of beauty in math.
Below is something I drew to replicate this. It took me back to my college days when I spent one summer hanging out with fellow plebes in the hallway, plotting problems on “mo boards.”
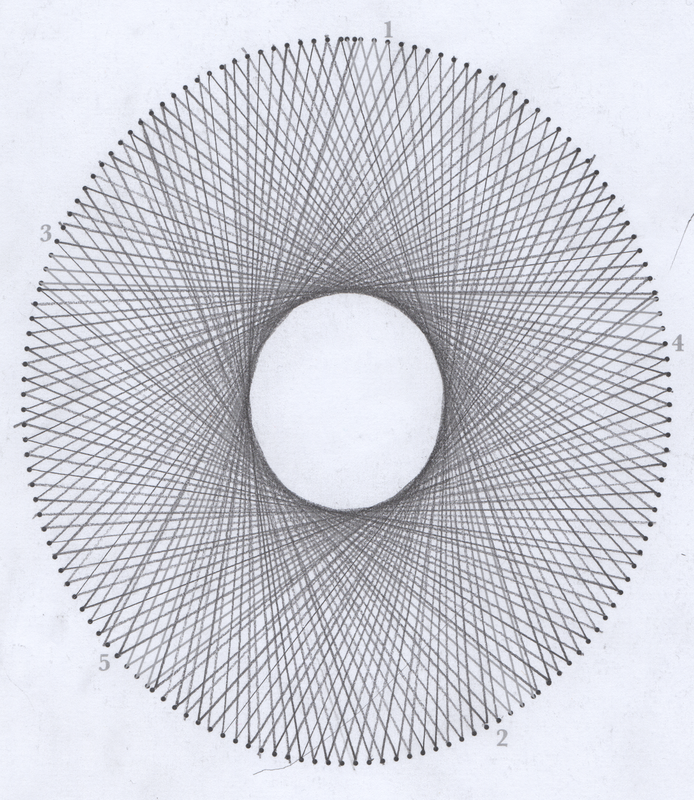
| I made a graph for you to explore this idea by drawing. You will need a transparent ruler and a sharp pencil. Before you draw, study the picture and observe the shape in the middle of the star. It looks like a pentagon. Find the dots labeled 1 and 2 and draw a line between them. Then find the dots labeled 2 and 3 and draw another line. Then, the dots labeled 3 and 4 and the dots labeled 4 and 5. Here comes the tricky part. You must draw a line between the dot labeled 5 and the dot next to dot 1. Be sure to focus on the dot near the pencil lines, not the printed ones. Then, continue drawing in the same order. | ||
Now, look at what happened to the pentagon in the center. Do you see into what shape it transformed? The math behind it is called Calculus!


 RSS Feed